Inflation blow to the Santo Tayyipito Myth
 I got an email from a loyal reader, who fervently believes that Turkish inflation statistics are cooked, shortly after the January figures were released on Feb. 3.
She claimed that the reported rise in tobacco prices of 2.38 percent could not be correct. I reassured her that I had full confidence in the Turkish Statistical Institute (TurkStat), but I could not provide a satisfactory explanation. That came from the agency on Feb. 5: Tobacco prices had been misentered; they in fact rose 7.42 percent in January. Monthly and annual headline inflation levels were revised upwards from 1.72 and 7.48 to 1.98 and 7.75 percent.
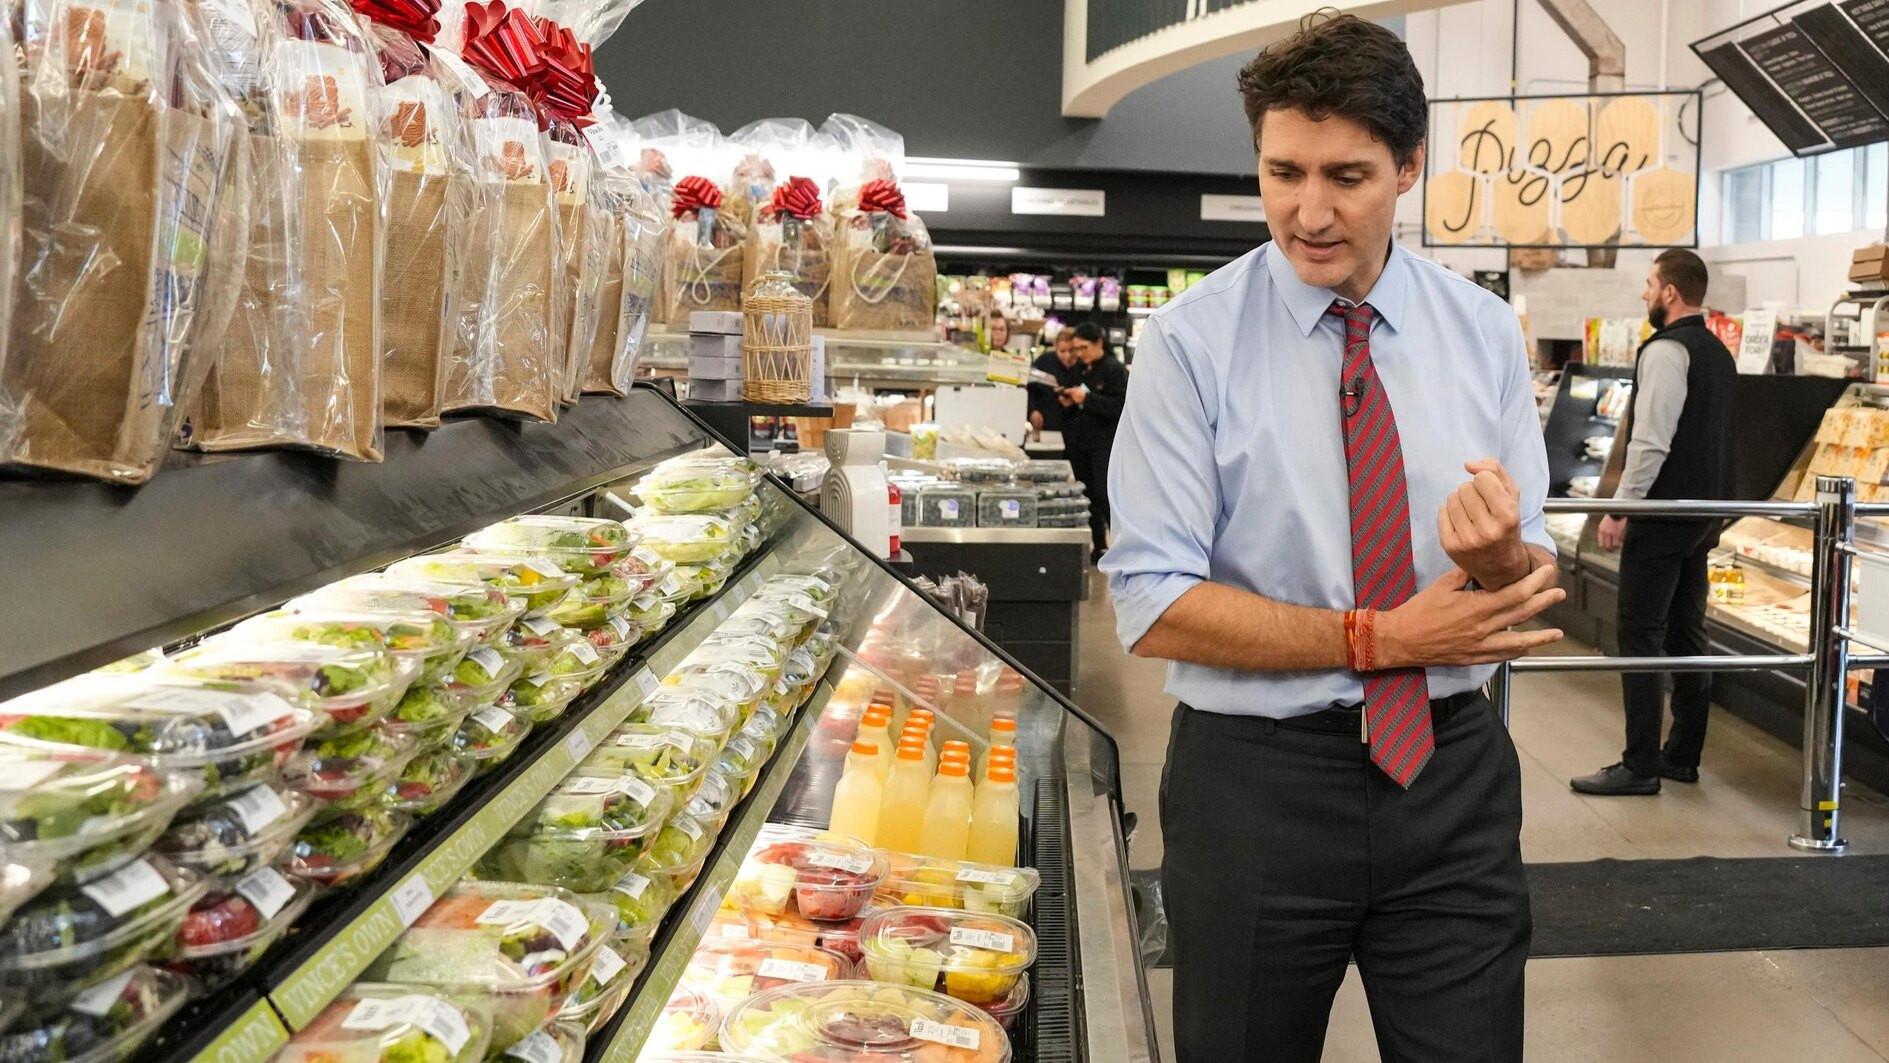
But the adjustment did not satisfy my reader, who told me that the rise in her monthly shopping bill was more than the revised number as well. I luckily had an explanation for that: Unless she bought big-ticket items like airline tickets back home to Washington or a new car, most of her monthly expenditures would be grocery shopping. Food prices rose 5.50 percent in January.
Even if she bought an international plane ticket, she probably would not remember how much she paid for it the last time she bought it. Those costly items that we do not buy everyday are actually an important part of the representative household’s basket used to measure inflation. TurkStat calculates and annually revises the weight of each of the 968 items there using survey data.
This explanation reveals an inherent problem with the inflation calculation: You would not expect anyone from the Koç and Sabancı families to spend more than 1 percent, let alone the official one quarter, of their income on food and beverages. Many destitute households, on the other hand, spend all their income on rent, food and utilities. Therefore, the “real” inflation felt by many households could be very different from the official figures.
In a note published on Feb. 4, analysts from Istanbul think tank Betam calculate inflation in the last decade for five income groups. They find rising inflation from the richest to the poorest quintiles: Whereas prices rose 131 percent for the richest 20 percent, inflation of the poorest 20 percent was 144 percent.

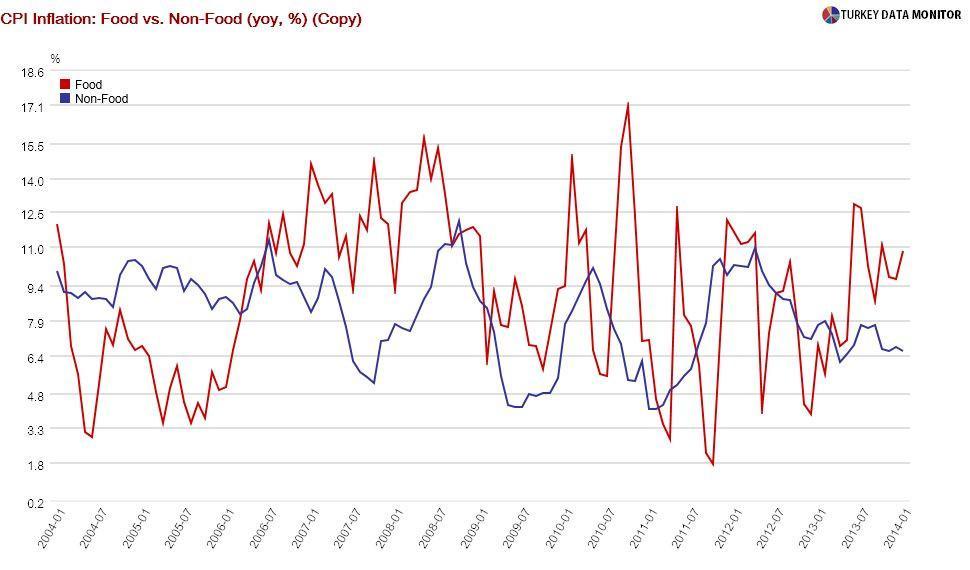
Inflation of the poorest was actually slightly lower than inflation of the richest from 2003 to 2006, but the trend has since reversed. The poorest households have been facing higher inflation than their wealthiest counterparts since 2007, mainly because of food prices. While it was lower than the headline figure until the end of 2006, food inflation has usually been higher since then.
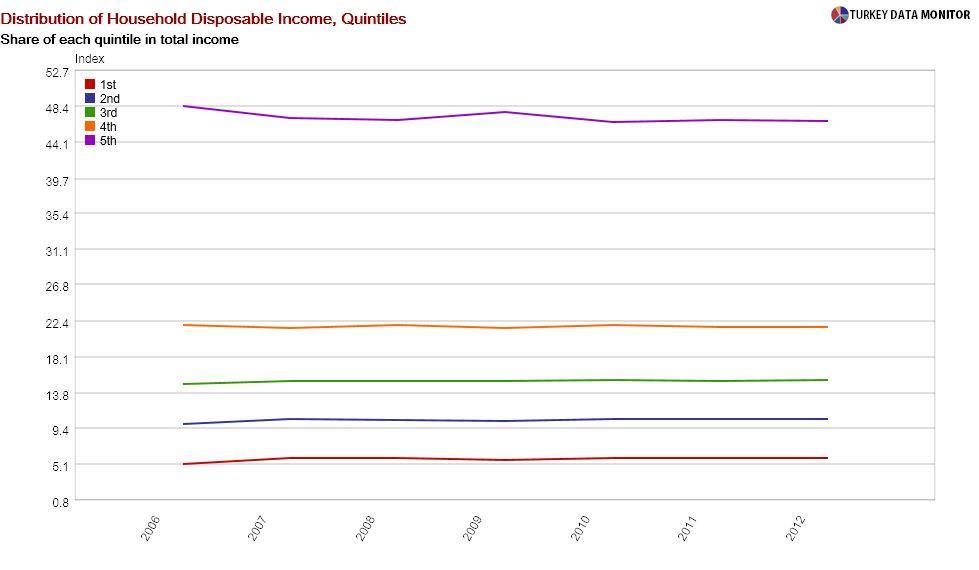
You could argue that the income of the poorest rose more than other groups during this period, making up for their higher inflation, but that is not the case at all. In fact, the share of each quintile in total household disposable income has more or less stayed constant since 2007.

If it weren’t for all the coal and food distribution, I would say that Prime Minister Recep Tayyip Erdoğan’s reputation as saint of the poor was nothing but a myth.


